Bandwango Data and Identified Travel Trends in 2021
.png)

This month, Bandwango took a look at projections from December 2020 to determine how theories about post-pandemic life correspond to the data we’ve captured over the last 5 months. We wanted to know how our data for pass usage stacks up against some of the trends forecasted by leading researchers and travel partners.
We’re pleased to report that overall, consumer appetite for things-to-do has gone way up from last year to this year. The report below shows total Bandwango orders for January – May 2020 and 2021.
Though this graph proves that travel has indeed “bounced back”, we wanted to take our analysis a step further to see what else we could discover about consumers and how they’re approaching travel now that vaccines are rolling out and people are starting to feel more comfortable traveling.
In December 2020, Expedia Group conducted a study of 2,200 Americans in collaboration with data intelligence firm The Morning Consult to better understand how the travel industry has evolved since the outset of the pandemic, and the way consumers are feeling about traveling in the year ahead. Read the full study here.
Much of our data analysis uses the trends identified in this report as a basis to report on our key findings.

Forecasted Trends
People who say their next vacation will be at least a week: 39%
With the expectation of week-long vacations in 2021, Bandwango evaluated paid passes to determine how this projected length of time would affect purchases.
Although 1-Day versions of paid passports still outperform longer lasting passes, one option Bandwango has started implementing is a 2-Day version of paid passports. These passports join the in typical 3-Day and 90-Day configuration.
The thought process behind this shift is that many consumers plan their trips around diversified experiences, which may mean that they they do not want to do the same kind of activities (museums, wine tastings, or attractions) 3 days in a row, particularly if they have a week to spend in destination.
In one use case where this logic was applied, a 2-Day Wine Pass launched in 2021 accounted for 11% of purchases made in the past 5 months. The 3-Day Wine Pass, on the other hand, only accounted for 3% of purchases.
51%
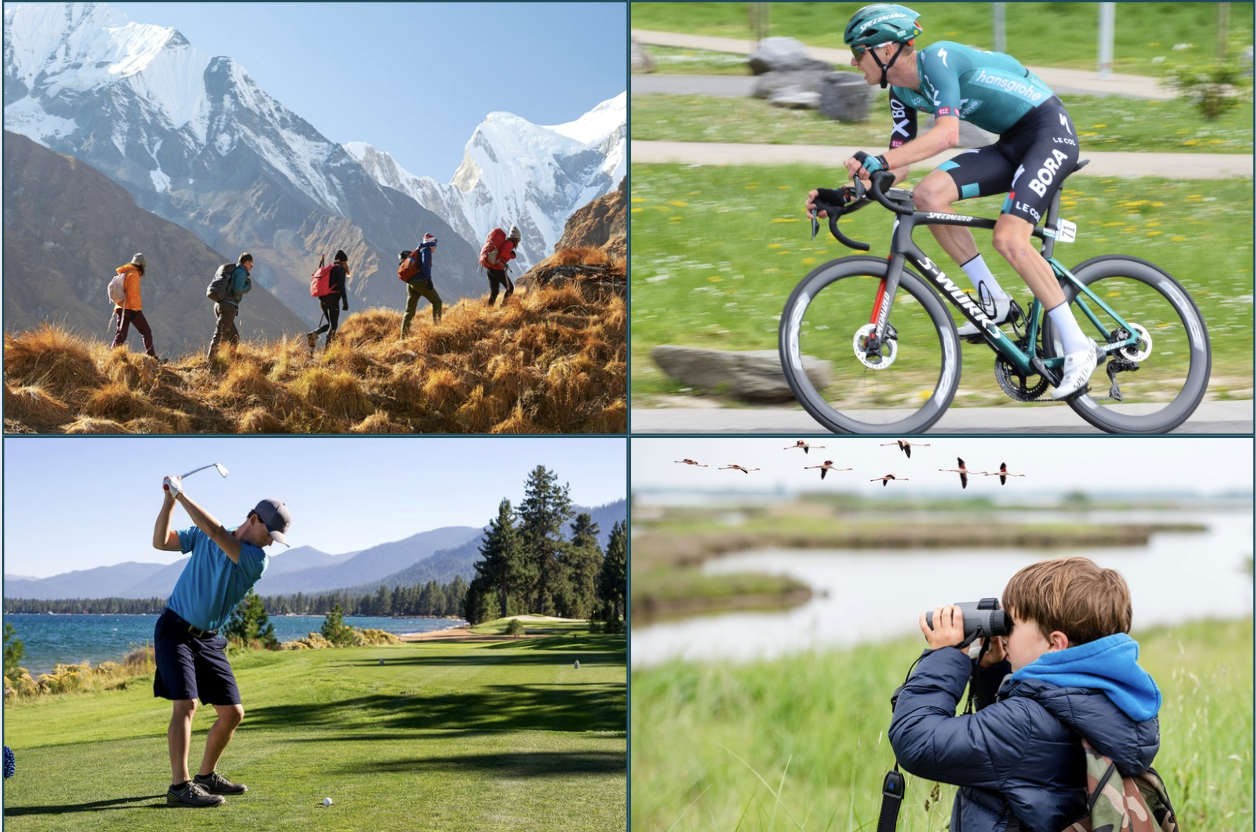
People who would love to take a US landmark tour
This presents an opportunity for destinations to show off the landmarks that make them special.
During 2020, we saw a surge in destinations building outdoor adventure passports and Pledge Passports so that people could experience their destination’s natural offerings safely. In 2021, more clients are focusing on building out experiences that showcase the culture of the region and their historical significance.
This increase has meant more Scavenger Hunts, Cultural Check-In Challenges and Paid Attraction Passes for Bandwango.
In 2020, Bandwango launched 18 Pledge Passes and Outdoor Passes in 5 months. In 2021, Bandwango launched 12 of this same pass type in a 5 month period.
In 2020, Bandwango launched 9 culture-focused passports in 5 months. In 2021, Bandwango launched 17 passports of this style in a 5 month period.
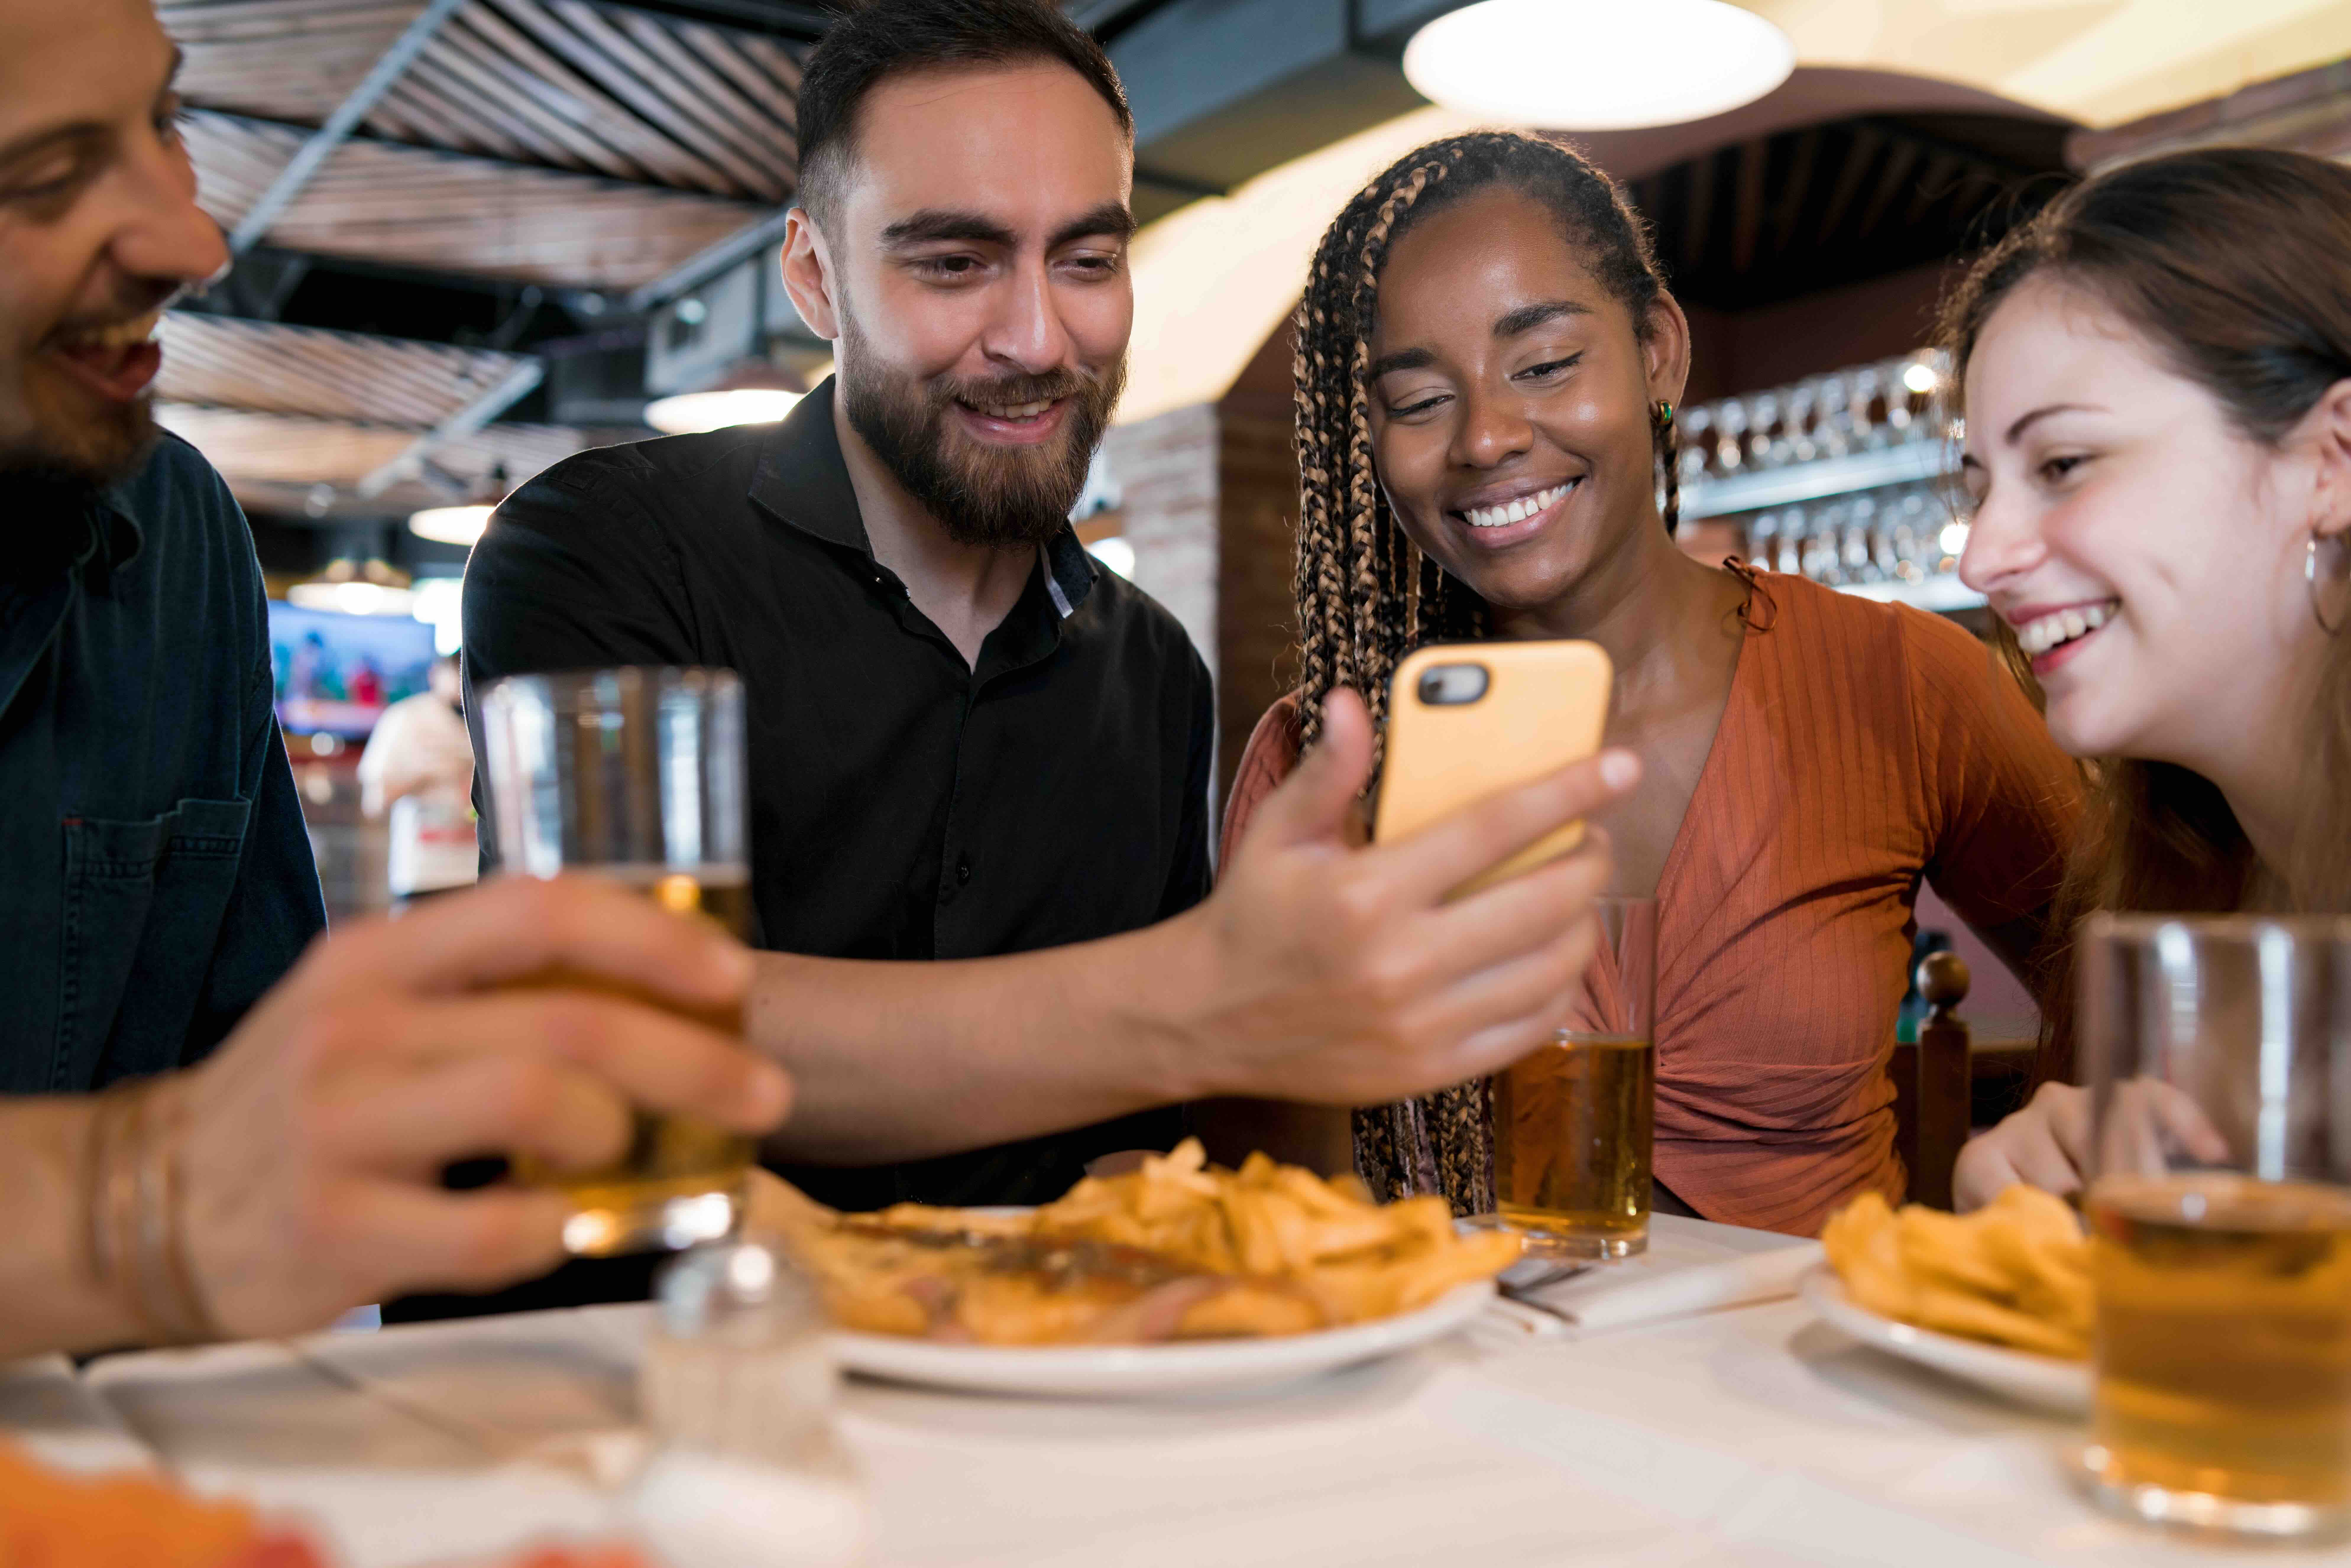
67%
Families who took a Flex-cation last year and would take one again
What is a “Flex-cation?” Vrbo® identifies this as a blend of vacation “play” with remote work and school.
In 2020, Bandwango began conversations with several EDOs and Chambers of Commerce who were hoping to utilize digital passport programs to drive remote workers into their destinations.
Now that people can work from anywhere, recruitment has become an entirely new landscape for these types of organizations.
Chattanooga’s Chamber of Commerce took a unique approach to this problem by launching their Business / Casual Pass with Bandwango earlier this month.
The passport encourages consumers to take a “workation” to Chattanooga, TN to see how they like it.
Using the passport, consumers can take advantage of discounts at local attractions, co-working spaces, restaurants, bars and outdoor offerings.
Are you inspired by some of the data in this report? Let’s take a look at how these findings could drive initiatives in your destination! Schedule a demo now, or, reach out to your Client Success Manager to chat about this blog.
.png)
.png)

.png)

.png)

.png)


.png)

.png)
.png)
.png)
.png)
.png)
.png)
.png)
.png)
.png)
.png)

.png)
.png)
.png)
.png)
.png)
.png)
.png)
.png)
.png)
.png)
.png)
.png)
.png)
.png)
.png)
.png)
.png)
.png)


.png)
.png)


.png)


.png)
.png)


-min.jpg)


%20(2).png)


.png)
.png)


.png)


